Department performance dashboard
This dashboard will allow you to have a quick and easily accessible view of your Department Performance.
Please note:We only offer the Department Performance tab when you have 'Department' as a custom field added your candidate responses and you have reserved the Department field in your settings.
This dashboard does not pull data from the following surveys:
- Career Page survey
- "Candidate applied", also known as "Confirmation Email" survey.
- Hiring Manager survey
- Other internal surveys such as Internal Partnership surveys
- Quality of Hire or Onboarding surveys
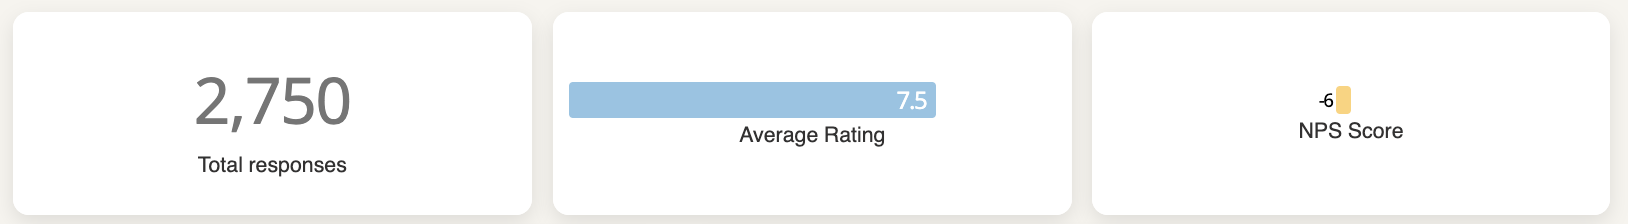
Overall number of responses, average rating and NPS score
On top of the page you'll find:
- Total responses
- Average rating (based on your star and grades questions)
- NPS Score
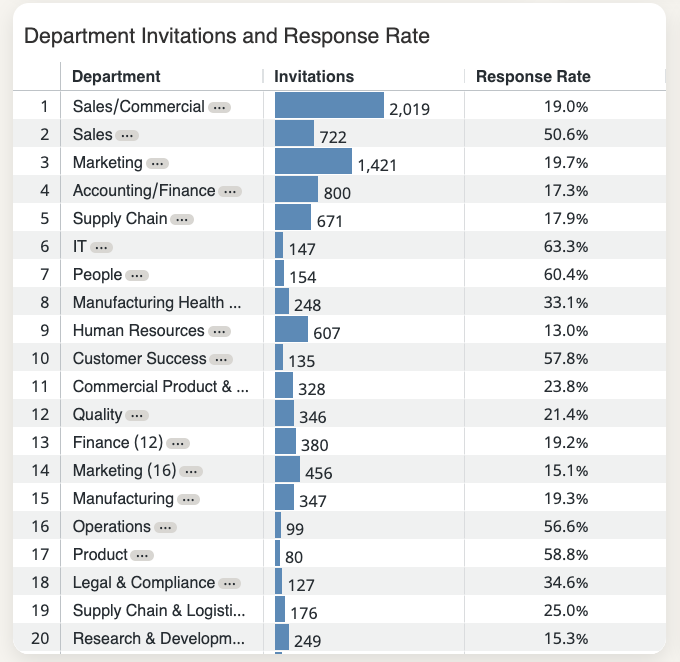
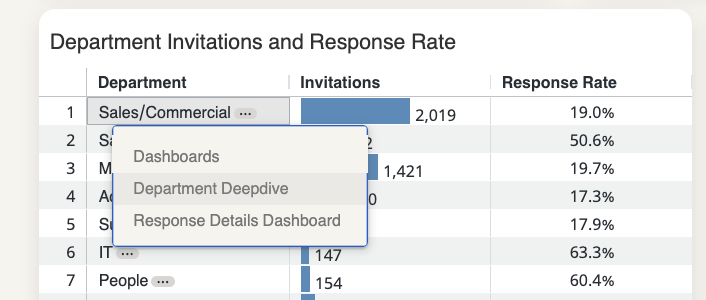
Department invitations and response rate
Just below, you will then find the same type of data, but this time it will be divided by department. This way you can easily compare the performance of your company’s departments.
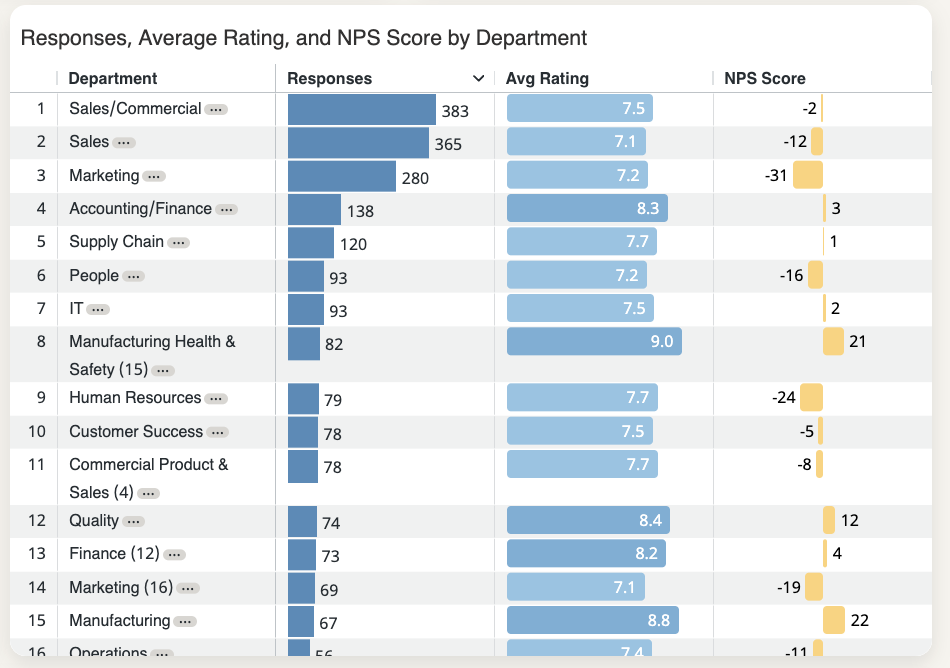
Department responses, average rating and NPS score
Here you'll find a breakdown of responses, average rating and NPS score by department, to easily compare.
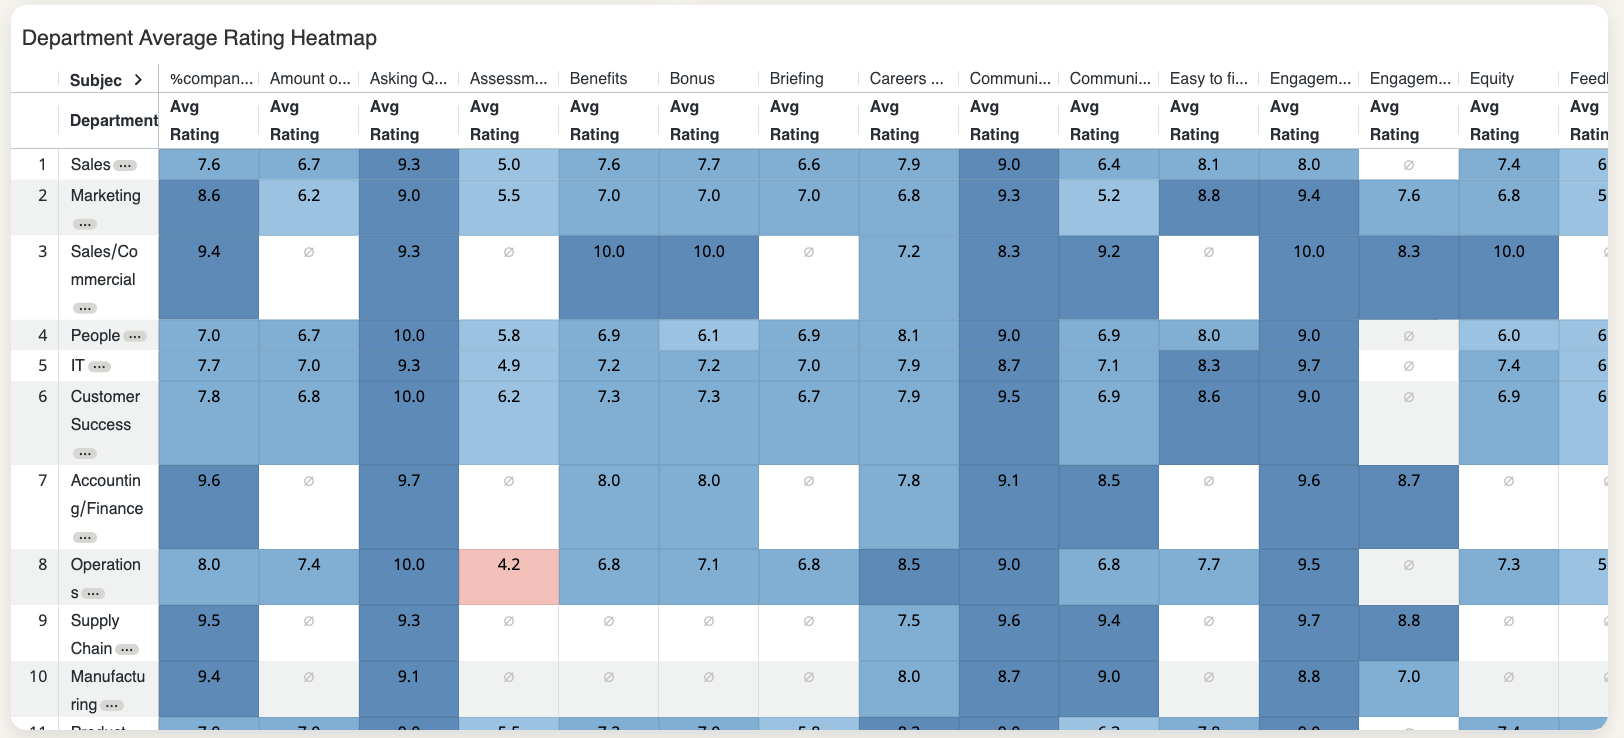
Department heatmap
The chart will offer ratings based on the subjects of your questions. Different colors will help you understand your department performance at a quick glance.
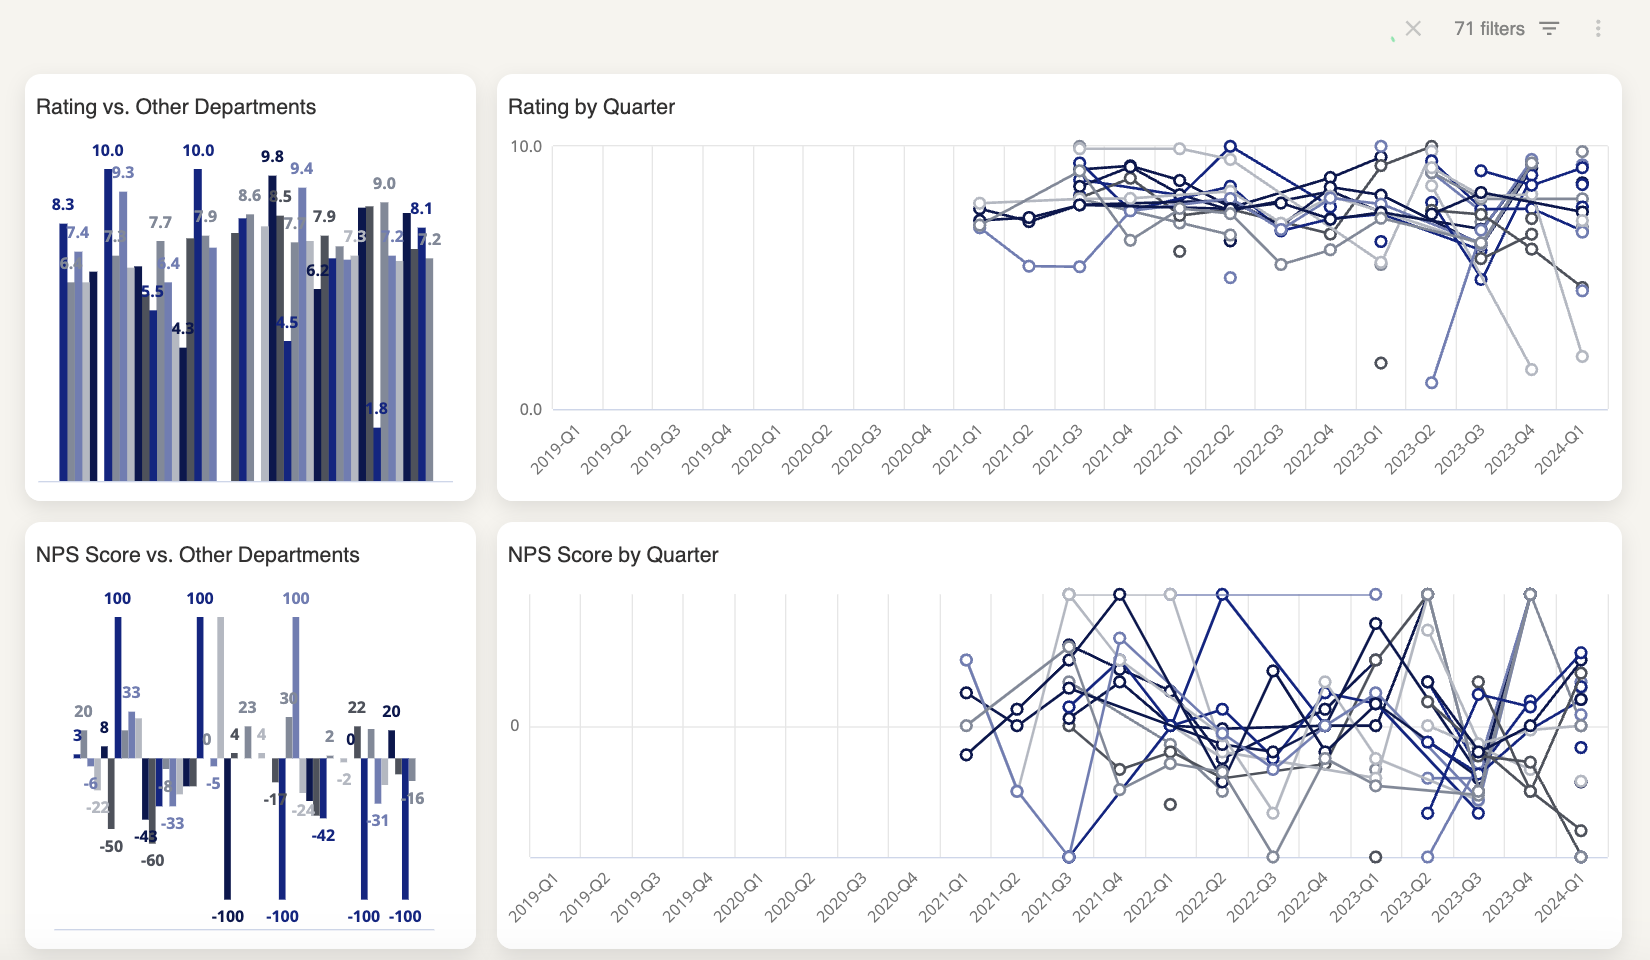
Department deepdive
To dive even deeper into your insights you can drill down into each department specifically by clicking on the three dots next to each department’s name and selecting “Department Deepdive”.
The dashboard that will open will show you the data related to that department in comparison with the overall department results.
It could look something like this, where the blue color represents your Department and the gray represents all other departments grouped together:
Please note:
- In the Deepdive section there will be a comments box where all comments left by your respondents are displayed. If the user role does not have the access right "Can view comments", then instead of the actual comment the user will see a message informing them that comments are not visible to them based on their permissions.
- When selecting the “Department deepdive” on a particular department, it shows the “Number of responses to NPS and Star rating questions”.
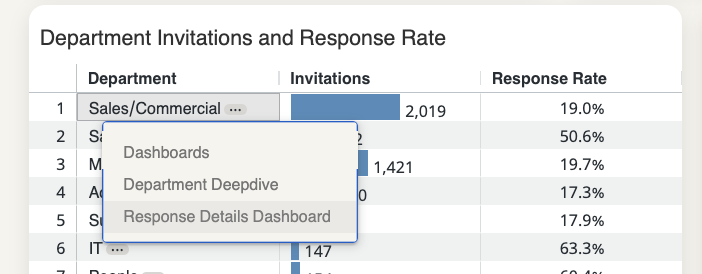
Department response details dashboard
You can get an overview of the custom fields linked to each response by clicking on the three dots next to each department’s name and selecting “Response Details Dashboard”.
We go more in depth about this topic here.
Updated 3 months ago