Platform Usage
This dashboard will give you an overview of the usage of Starred for the last 30 days.
This includes a month to month development of sent invitations, received responses and responses rate as well as the trend compared to the previous 30 days.
Monthly platform usage
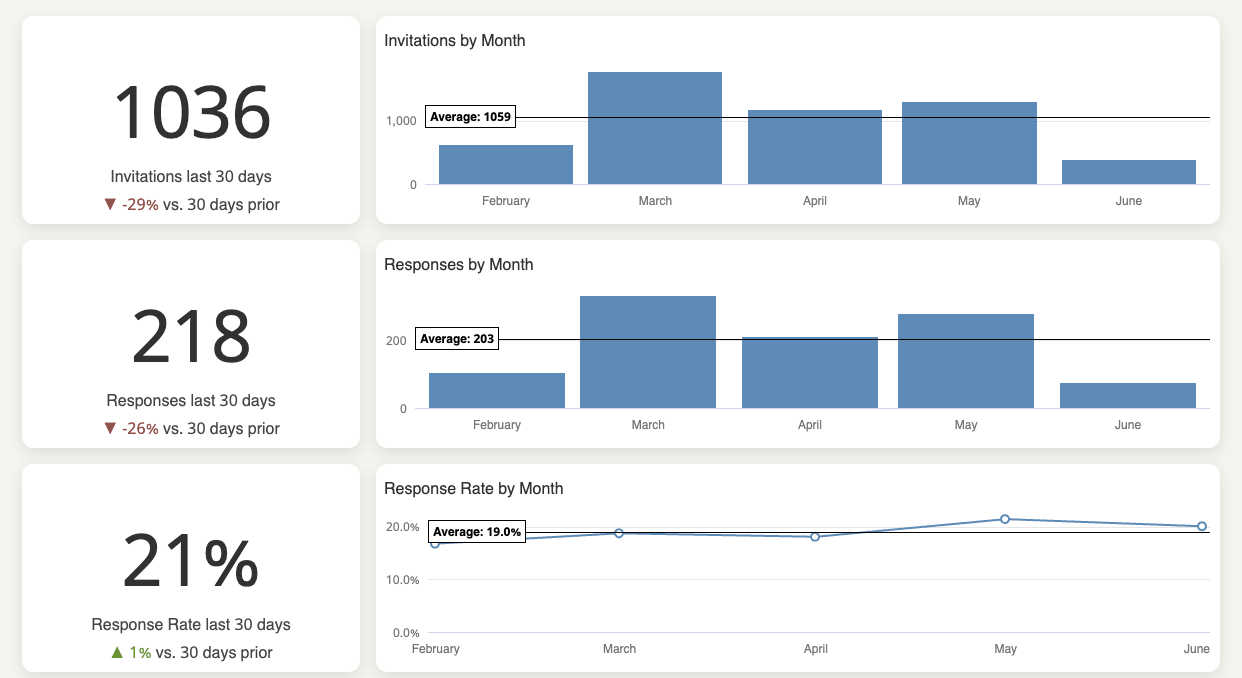
On the left side you will see data based on the last 30 days on:
- Number of invitations (along with a comparison to the previous month)
- Number of responses (along with a comparison to the previous month)
- Response rate (along with a comparison to the previous month)
On the right side you will see:
- a monthly breakdown of your invitations, responses and response rate
- an indication of your average
Recent invitations and responses
Lastly, in the two bottom charts you’ll see a list of all most recent invitations and responses.
The invitations list will include:
- date
- survey title
- sender name
- whether and when the invitations have been answered.
The responses list will display the respondent name (if not anonymous) and the answered date.
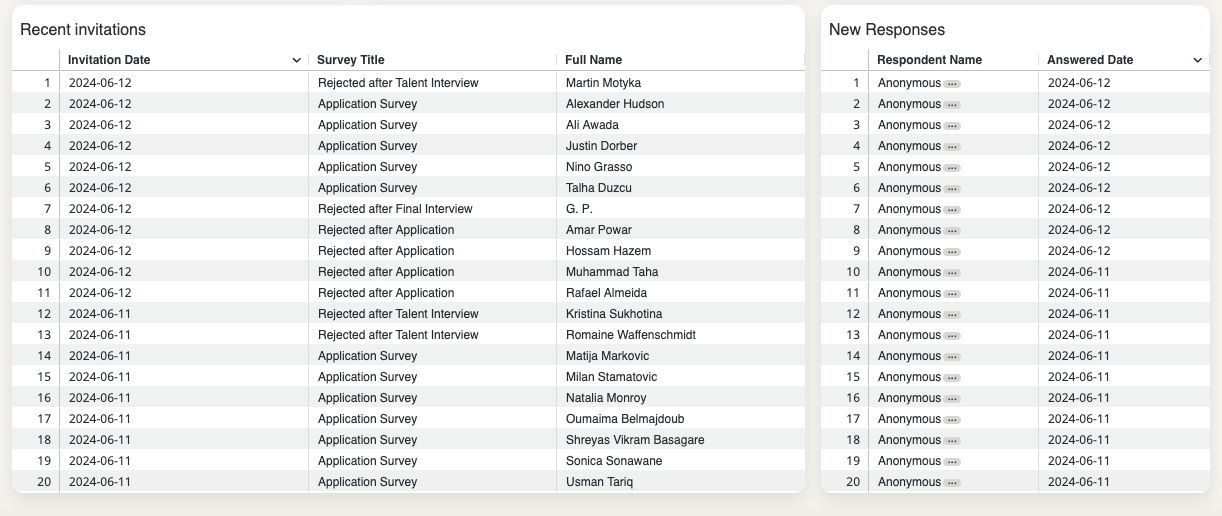
To open an individual response, you can click on the 3 dots next to the respondent name. The individual response will open in a separate tab.
Updated 10 months ago
Did this page help you?