How to use the dashboard
Your guide on how to use the Starred dashboard to analyze results
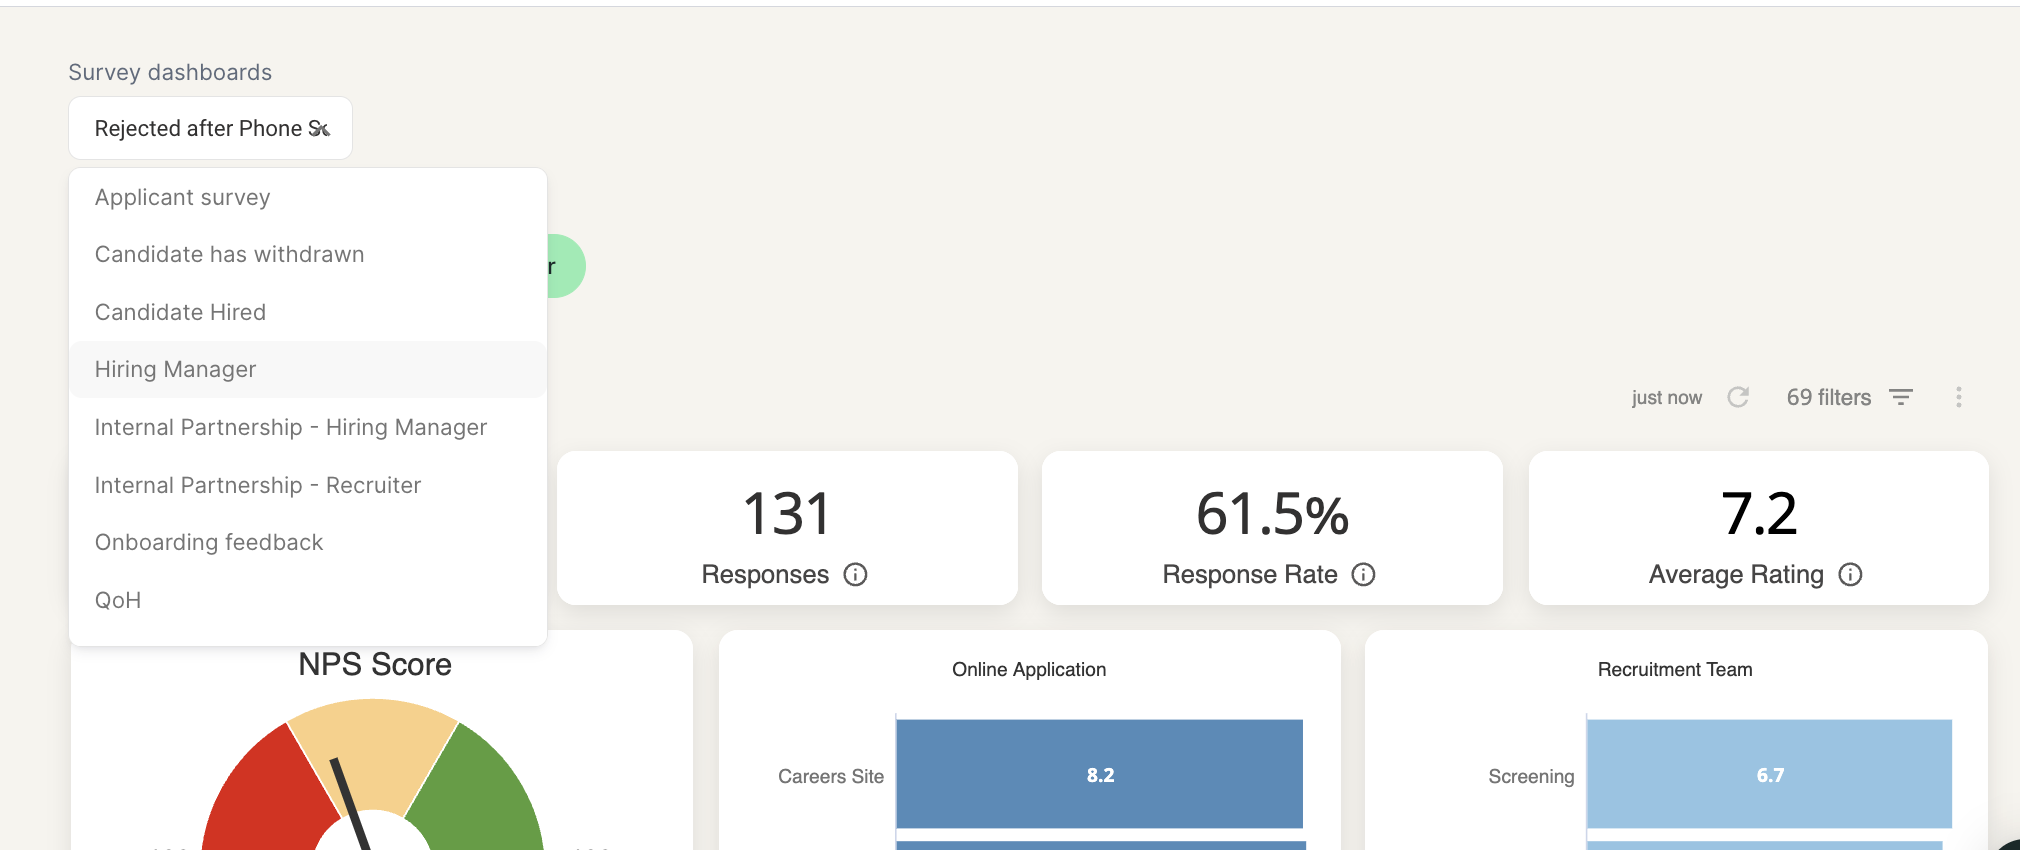
Once on the dashboard, you can easily navigate between surveys using the dropdown menu on the top left corner.
The first box you’ll see under the survey name is the one with the filters. Starred offers the possibility to filter through your survey responses to retrieve specific information.
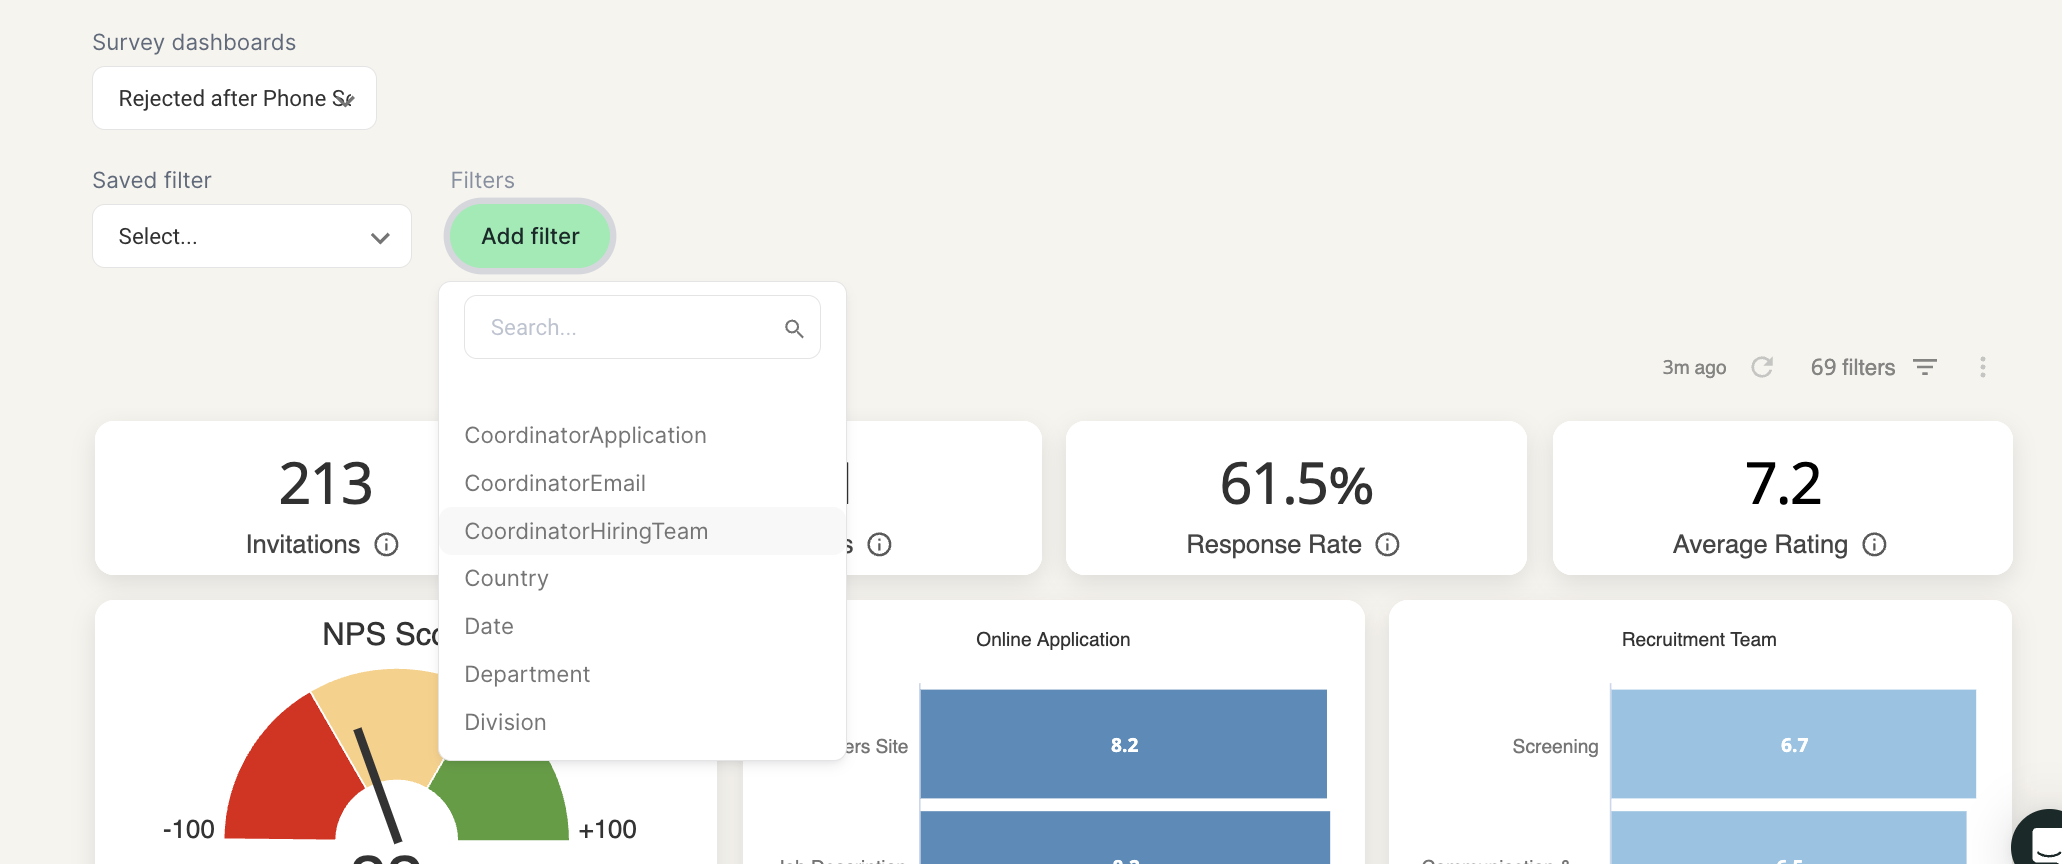
If you want to learn more about Starred’s filter functionality, head over to our dedicated article.
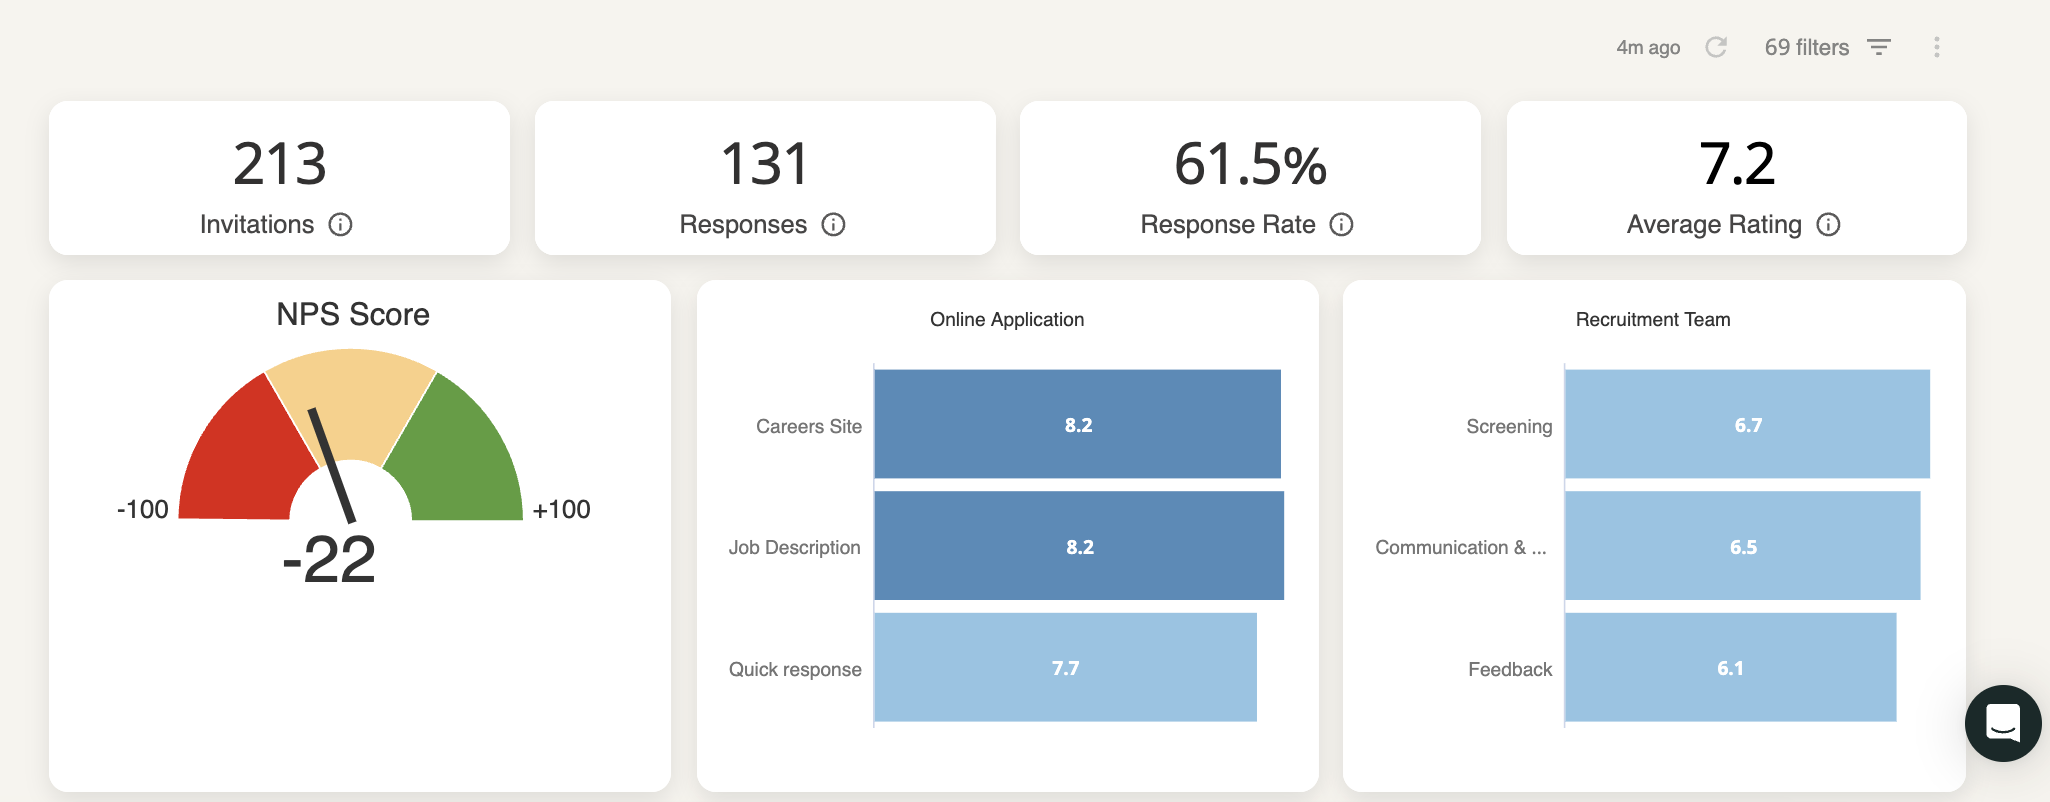
The dashboard tiles include important information such as:
- The number of invitations you have sent
- The responses you have gotten
- A percentage of response rate
- Your average rating (from your ratings questions, which are grades and star questions)
The next sections will vary depending on the questions you have asked in your surveys. In fact, these boxes contain information about the ratings that your respondents have given you.
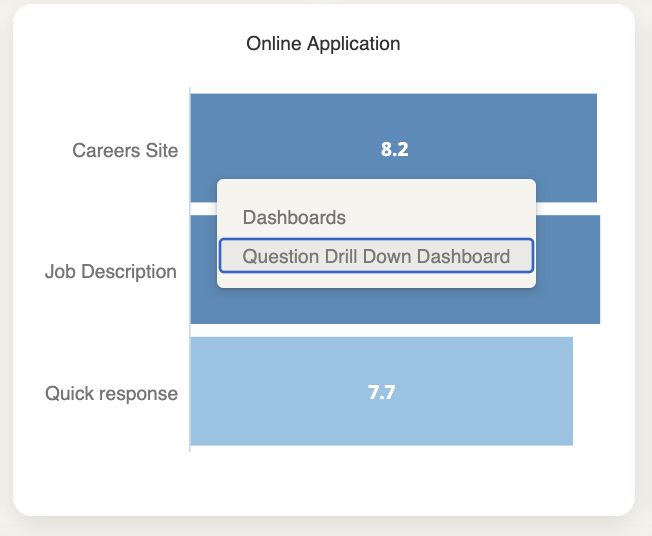
See an example of a survey dashboard below: the three tiles underneath invitations, responses, response rate and average ratings reflect the questions that are being asked in the survey. In this case, there's an NPS question block and two rating question blocks, one called Online Application and one called Recruitment Team.
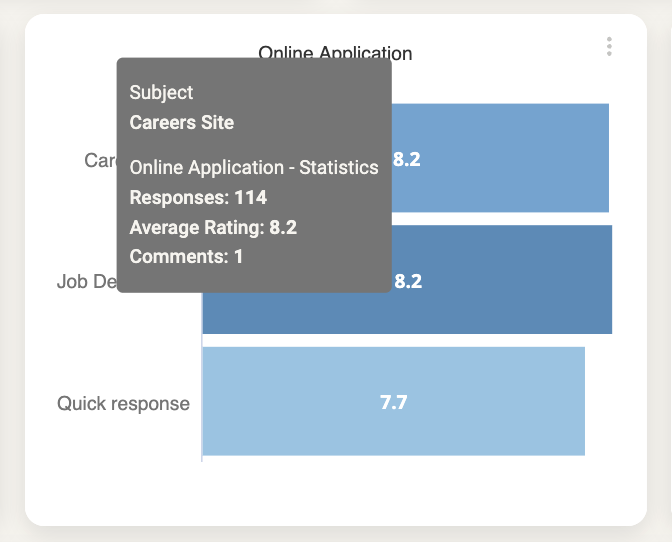
For your ratings questions, hovering over the graph allows you to read the full question.
Question Drill Down Dashboard
By clicking on the ratings, you will be able to drill down into each question. We’ll dive into this topic in a separate section.
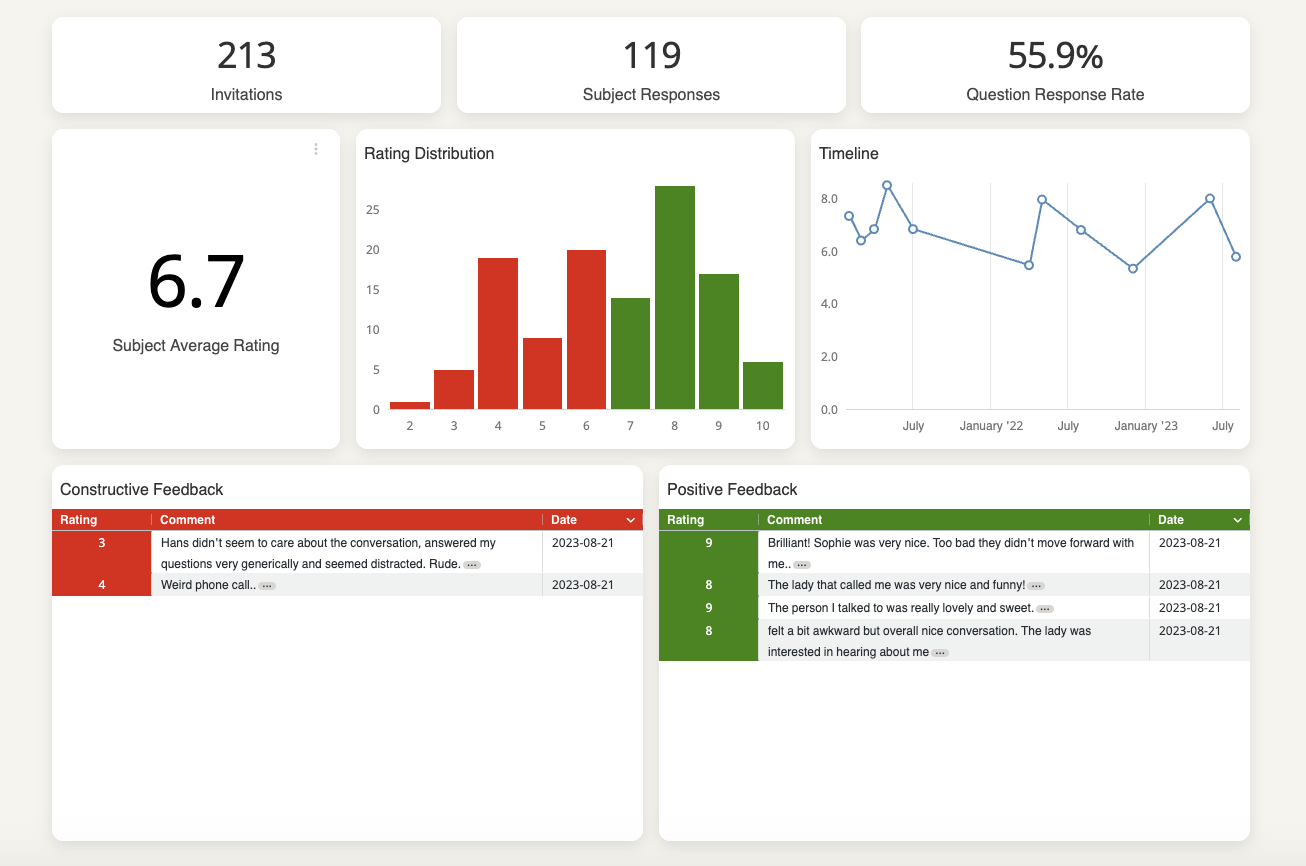
You’ll be redirected to a dashboard specific for that question, where you can really dive deep into your results.
The overview will look the same as the regular dashboard, meaning it will offer the same options to filter through your results as well as downloading your data, which will discuss in this article.
However, this overview will also give detailed information for the question you've selected such as the number of responses, average rating, distribution, timeline and comments for this question.
Comments
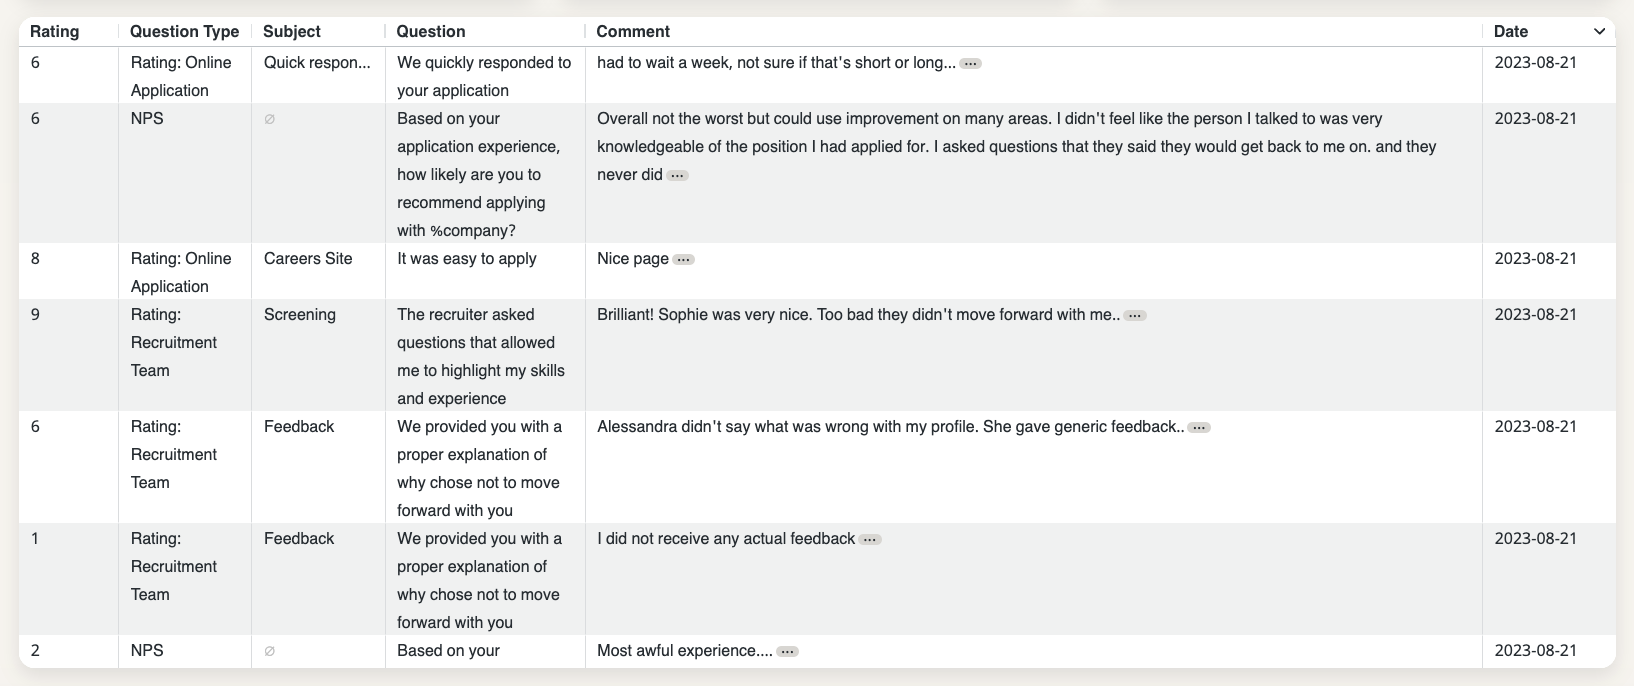
Below your question blocks, you'll find a table showcasing all the comments you've received to your questions. Comments are open feedback that respondents can leave to further elaborate on their experience.
Whether this is the comment they leave to the NPS question, a feedback they give to any open questions you might have asked or a comment they deliberately decide to leave after rating you within your Stars/Grades questions.
The comments table will contain information on the question, the rating, the subject as well as the date:
Please note:Respondents can leave comments to all questions, also ones where they are not asked to leave a rating, such as your Multiple Choice questions or Yes/No questions.
For those, you'll still see a "rating" listed in the table. This is just a notation to identify the response given (for instance, for Yes/No questions 1 means Yes and 0 means No): responses to Multiple Choice questions and Yes/No questions do not count towards your average rating.
Next to each comment there are three dots: by clicking on them, you can expand the comment by opening the response in a separate tab.
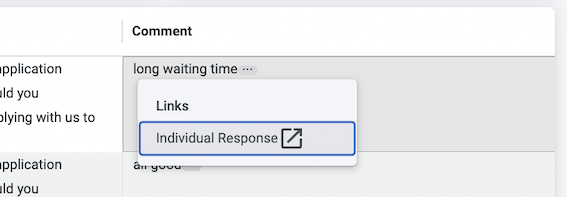
From here, you’ll be able to see the respondents data as well as contact them.
Please note:Only users with the access right "Can view comments" will see the actual comments in this box. If you do not have that access right, you will see a message informing you that comments are not visible to you based on your permissions.
Updated 11 months ago
Learn More
You might also be interested in...