Hiring Manager dashboard
This dashboard will display results related to all your surveys linked to the Hiring Manager journey type.
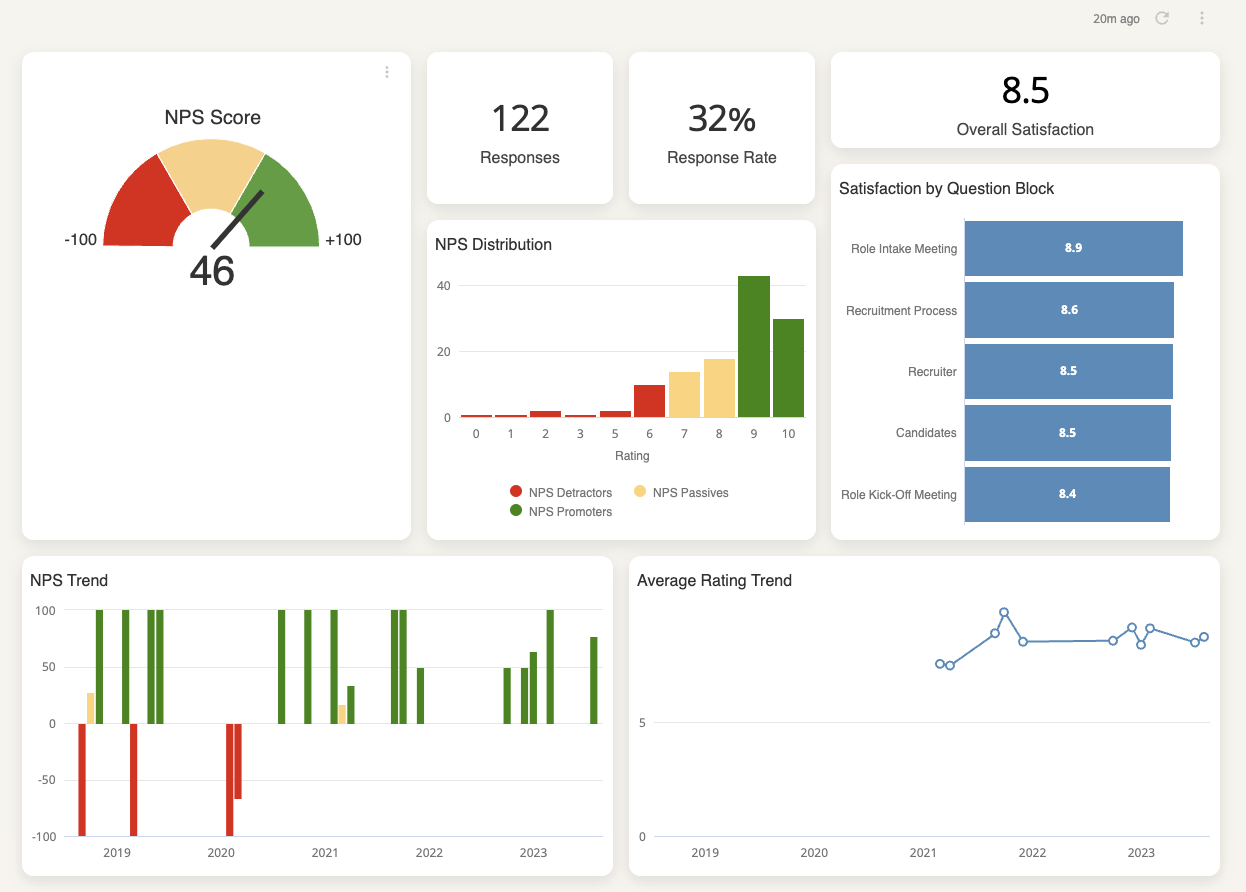
Overall number of responses, average rating and NPS score
These charts will show:
- NPS score
- Number of responses
- Response rate
- Average satisfaction (based on your star and grades questions)
- NPS distribution (detractors, passives, promoters)
- Satisfaction based on your question blocks
- NPS trend (development of your score over time)
- Average trend (development of your score over time)
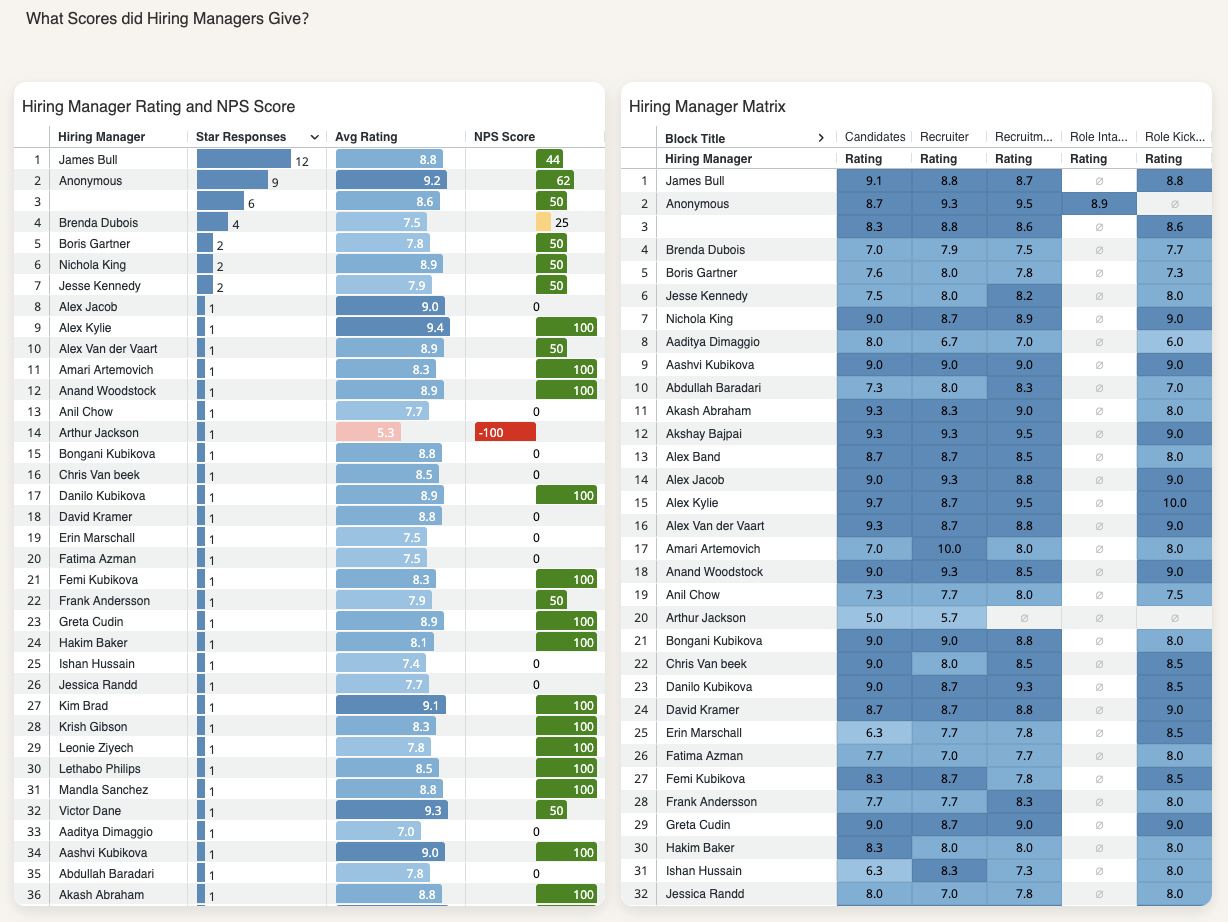
Hiring Manager ratings and NPS score and Hiring Manager Matrix
The next charts will show ratings given by your Hiring Managers, with a breakdown on the different subjects.
- Left chart: number of responses to the star and grade questions and NPS question.
- Right chart: average ratings of the different individual questions.
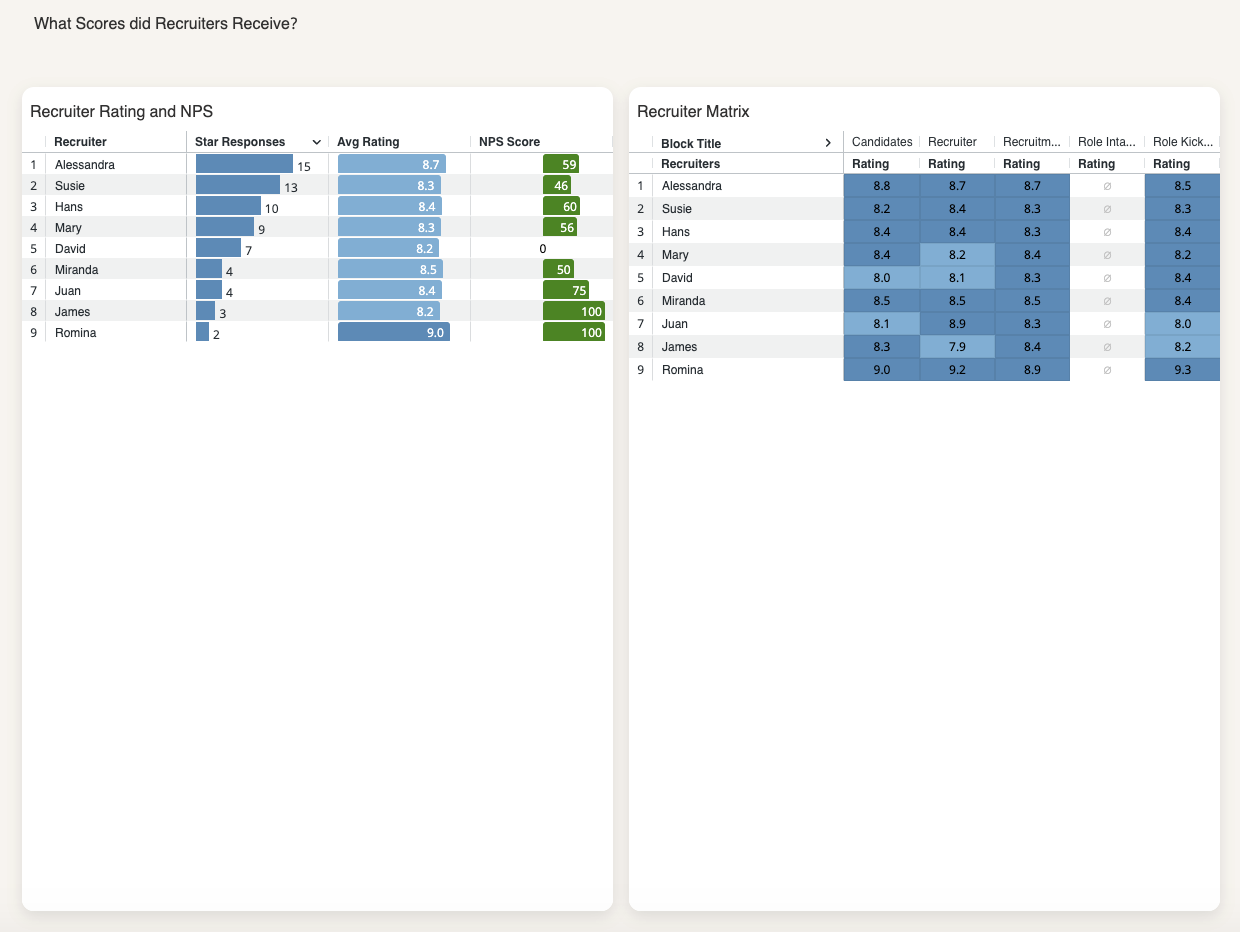
Recruiter ratings and NPS score and Recruiter Matrix
The last two charts will show the ratings your recruiters received from the hiring managers.
These will therefore differ from what you’ll see in the Recruiter performance dashboard, which shows external feedback from candidates.
- Left chart: number of responses, average ratings and NPS score.
- Right chart: average ratings of the different individual questions.
Updated 10 months ago
Did this page help you?