How to Export Data from Starred
Export your survey results from any part of your Starred dashboard—from overview data to detailed responses and comments - in multiple formats for analysis and reporting.
Overview
Whether you need to analyze survey trends, share results with stakeholders, or create custom reports, Starred's export functionality gives you complete access to your data. You can download information from every part of your dashboard, including overview metrics, question drill-downs, individual responses, and comment analysis.
Starred allows you to export data from multiple locations throughout your dashboard:
Complete survey result summaries with all key metrics and visualizations
Specific question results and metrics for targeted analysis
Side-by-side survey analysis for trend identification
All survey feedback and responses for qualitative insights
Complete response datasets with properties and metadata
Throughout Starred, look for the three vertical dots (⋮) menu to access download options. This universal indicator appears wherever data export is available.
Exporting Complete Dashboards
Accessing Dashboard Exports
- Navigate to any dashboard containing your survey results
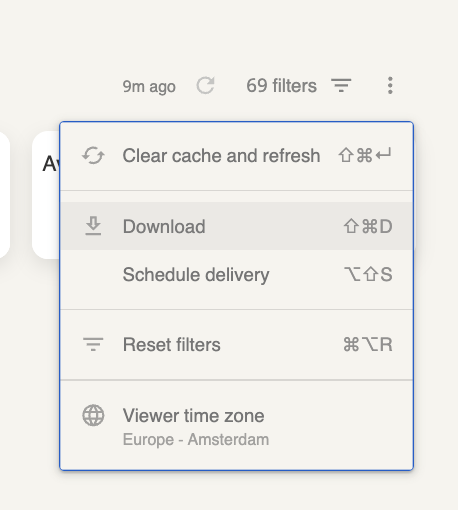
- Locate the three vertical dots (⋮) in the upper-right area above your data
- Click the dots to reveal the dropdown menu
You'll see two primary options:
- Download - Immediate export to your computer
- Schedule delivery - Set up recurring reports (learn more about scheduled reports)
- Choose your export format
- Select Download for immediate access. You can export your data in two formats:
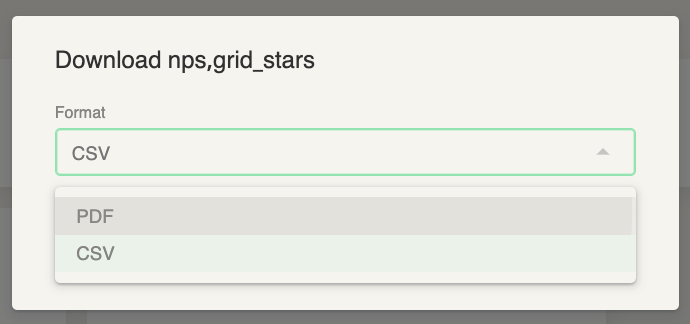
PDF Export
Best for: Presentations, executive summaries, visual reports
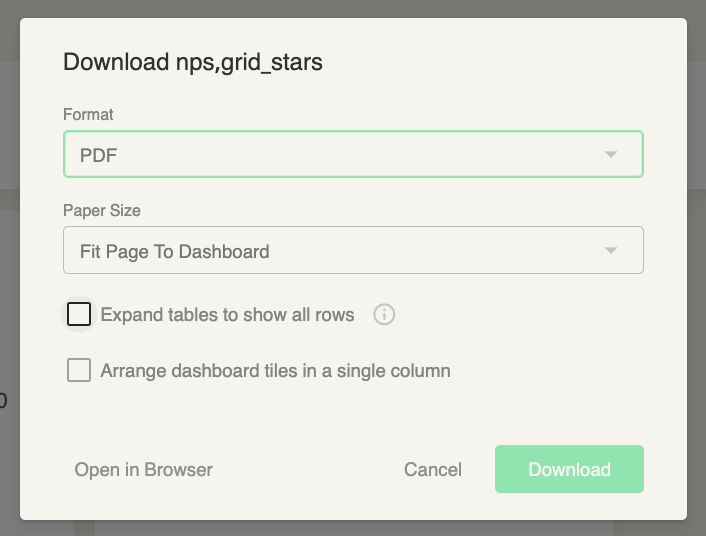
When selecting PDF, customize these settings:
- Page layout - Portrait or landscape orientation
- Content options - Include/exclude specific sections
CSV Export
Best for working with data, copying information, or viewing all comments. This provides the most flexibility for analysis and manipulation.
Handling Large Tables in PDF
PDF exports can sometimes cut off large tables. To prevent this:
- In the PDF export dialog, check "Expand tables to show all rows"
- This ensures complete table data in your export
Important NoteEven with table expansion enabled, very large datasets may still face formatting issues in PDF. For extensive data analysis, CSV format provides better reliability.
Exporting Individual Charts and Questions
Sometimes you need specific question results rather than entire dashboard data. This approach helps you:
- `Focus on particular metrics
- Share specific findings with team members
- Analyze individual question performance
How to Export Chart Data
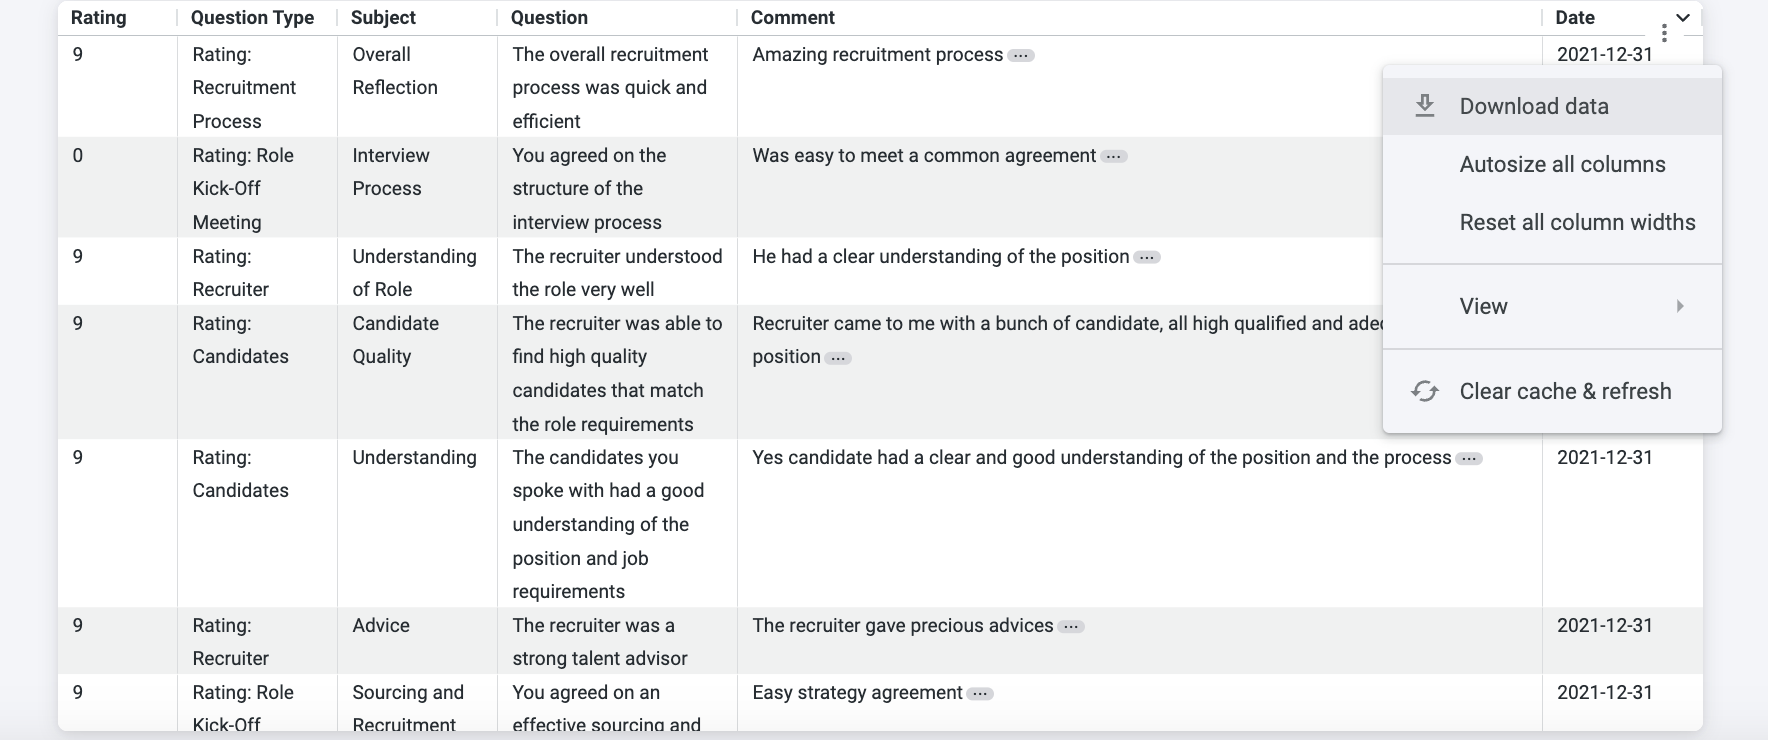
- Hover over any chart until the three dots (⋮) appear in the top-right corner
- Click the three dots to open the menu
- Select "Download data"
- Choose your preferred export format:
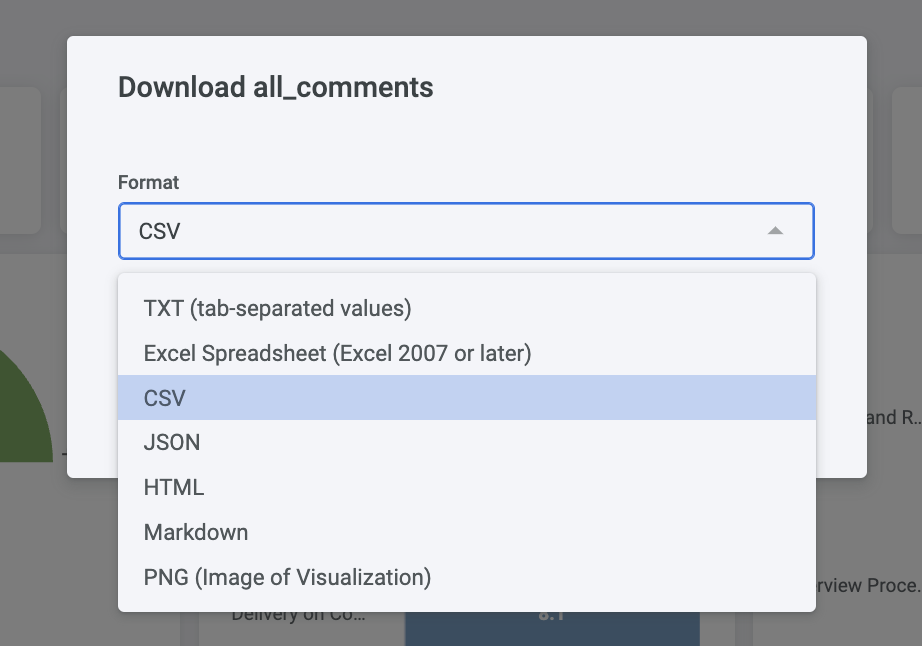
Best Practice for CommentsWhen exporting comment boxes, always choose CSV format. This makes it easier to analyze feedback, sort responses, and extract insights from qualitative data.
CSV Rows Export Limitations
- Default limit: 500 rows
- Maximum limit: 5,000 rows
- To export all data: Select "all results" in Advanced Download settings
Exporting Individual Response Data
This export contains the complete dataset of survey responses, including:
- All submitted answers
- Response timestamps
- Associated properties and metadata
- Participant information (where available)
To export individual responses:
- Navigate to your "Responses" tab
- Click the three vertical dots (⋮)
- Select "Export to CSV"
- Check your email - Individual response exports are delivered to your inbox immediately as CSV files, which you can:
- Open in Excel, Google Sheets, or other spreadsheet applications
- Import into analytics tools for deeper analysis
- Use for creating custom reports and visualizations
Using Filters with Exports
Filters allow you to export specific subsets of your data based on:
- Time periods - Specific date ranges
- Response criteria - Particular answer types or values
- Participant segments - Specific groups or demographics
To apply filters before exporting:
- Set up your desired filters before beginning the export process
- Verify the filtered data appears correctly in your dashboard
- Proceed with export using any of the methods above
- Your export will contain only the filtered subset of data
Learn MoreFor detailed instructions on using filters, see our dedicated filtering guide.
Working with CSV Files
After downloading CSV files, you might notice that Excel or Google Sheets doesn't immediately separate data into columns. This is normal and easily fixable.
We provide a complete step-by-step guide for converting CSV files into properly formatted spreadsheets:
How to Convert CSV Files to Excel or Google Sheets →
This guide covers:
- Opening CSV files correctly
- Separating data into columns
- Formatting for optimal readability
- Preserving data integrity during conversion
Next Steps
Now that you understand Starred's export capabilities:
- Try exporting a dashboard to see the full range of available data
- Experiment with individual chart exports for focused analysis
- Set up filters to create targeted data exports
- Consider scheduling regular reports for ongoing data delivery
Updated 8 months ago